Candle Data
What is Candle Data?
The Candle Data feature allows users to integrate candlestick data for any selected trading symbol.
It works similarly to selecting a symbol on TradingView, but with added flexibility that allows:
- Selection of multiple data points
- Strategy-building using multiple data sources and technical indicators
This enables users to construct more advanced, rule-based trading strategies beyond traditional charting tools.
Adding Candle Data
To add Candle Data, users must:
- Select a symbol.
- Configure the following settings:
- Element Name
- Data Type
- Time Duration
- Candle Type
- (For F&O) Expiry and Strike Selection
Element Name
Every Candle Data input requires an Element Name, which acts as a unique identifier in the system's strategy framework.
- This name is user-defined.
- It helps reference this specific candle data when building or executing strategies.
Tip: What is the Element Name?
The Element Name is a custom, unique label for each Candle Data or Indicator element.
It’s how the system identifies and uses this data in strategy logic.
Types of Data
Users can choose from three types of market data based on their trading style or strategy:
1. Spot Data
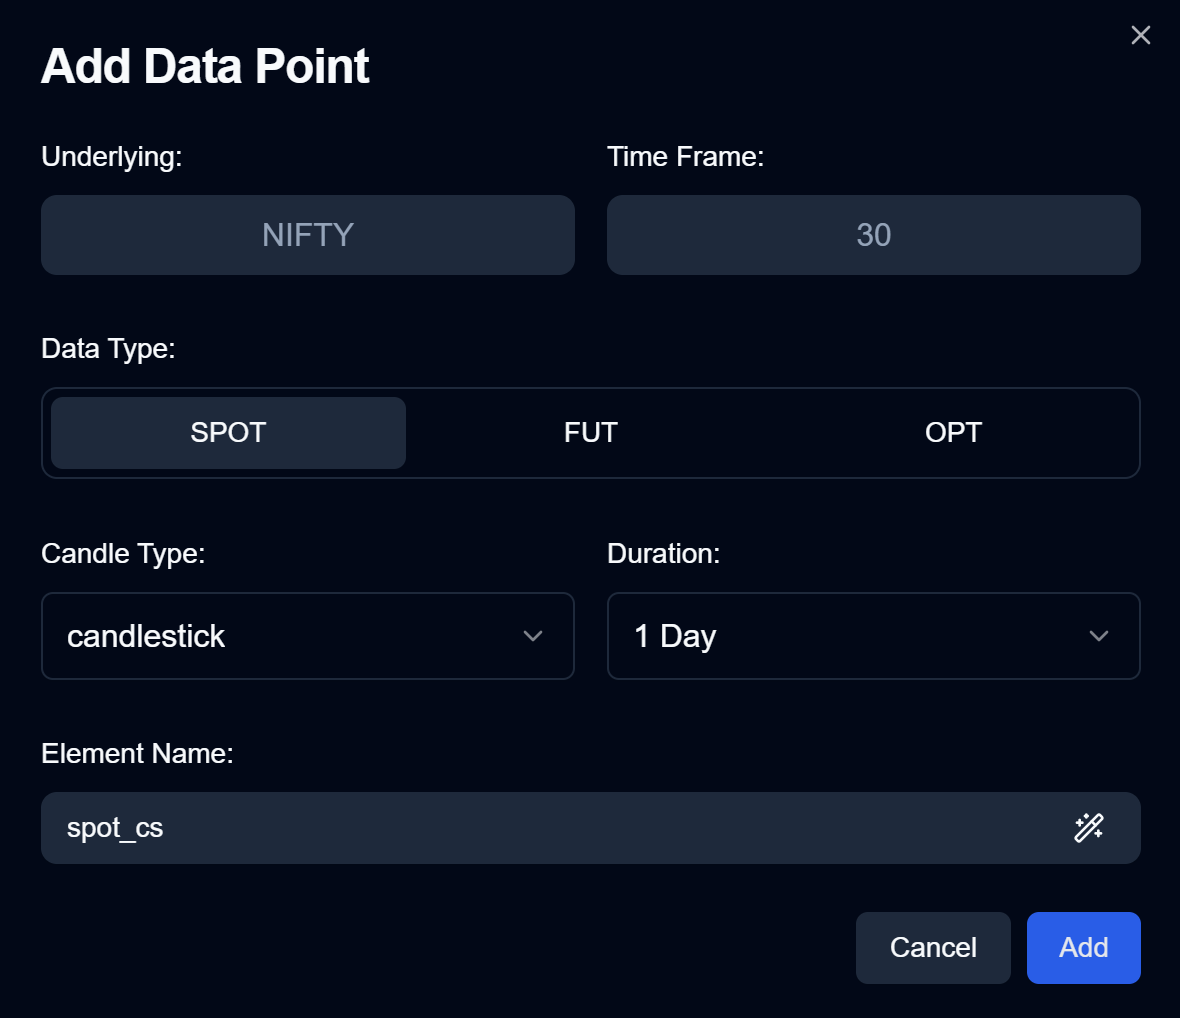
- Represents the spot price for the selected symbol.
- For Indices: Displays the index price (e.g., NIFTY, BANKNIFTY).
- For Stocks: Reflects the cash market price (not futures).
2. Futures Data
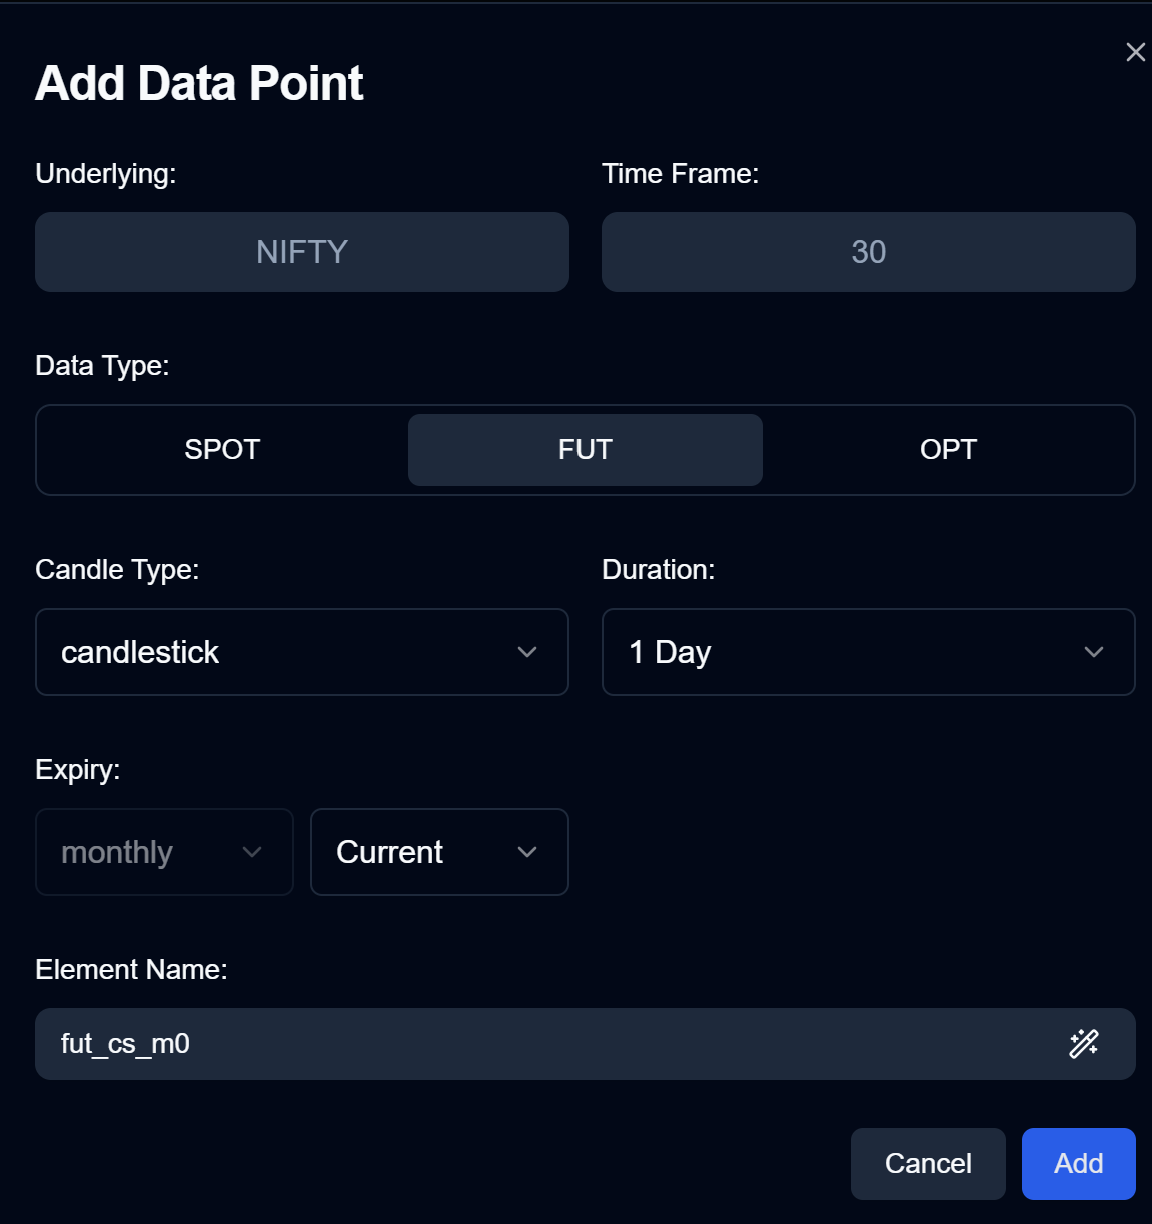
- Represents prices of the Futures Contract for the chosen symbol.
- Users can select:
- Between Weekly or Monthly contracts (based on availability).
- Specific Expiry Number (e.g., Current, Next, Next+1).
3. Options Data
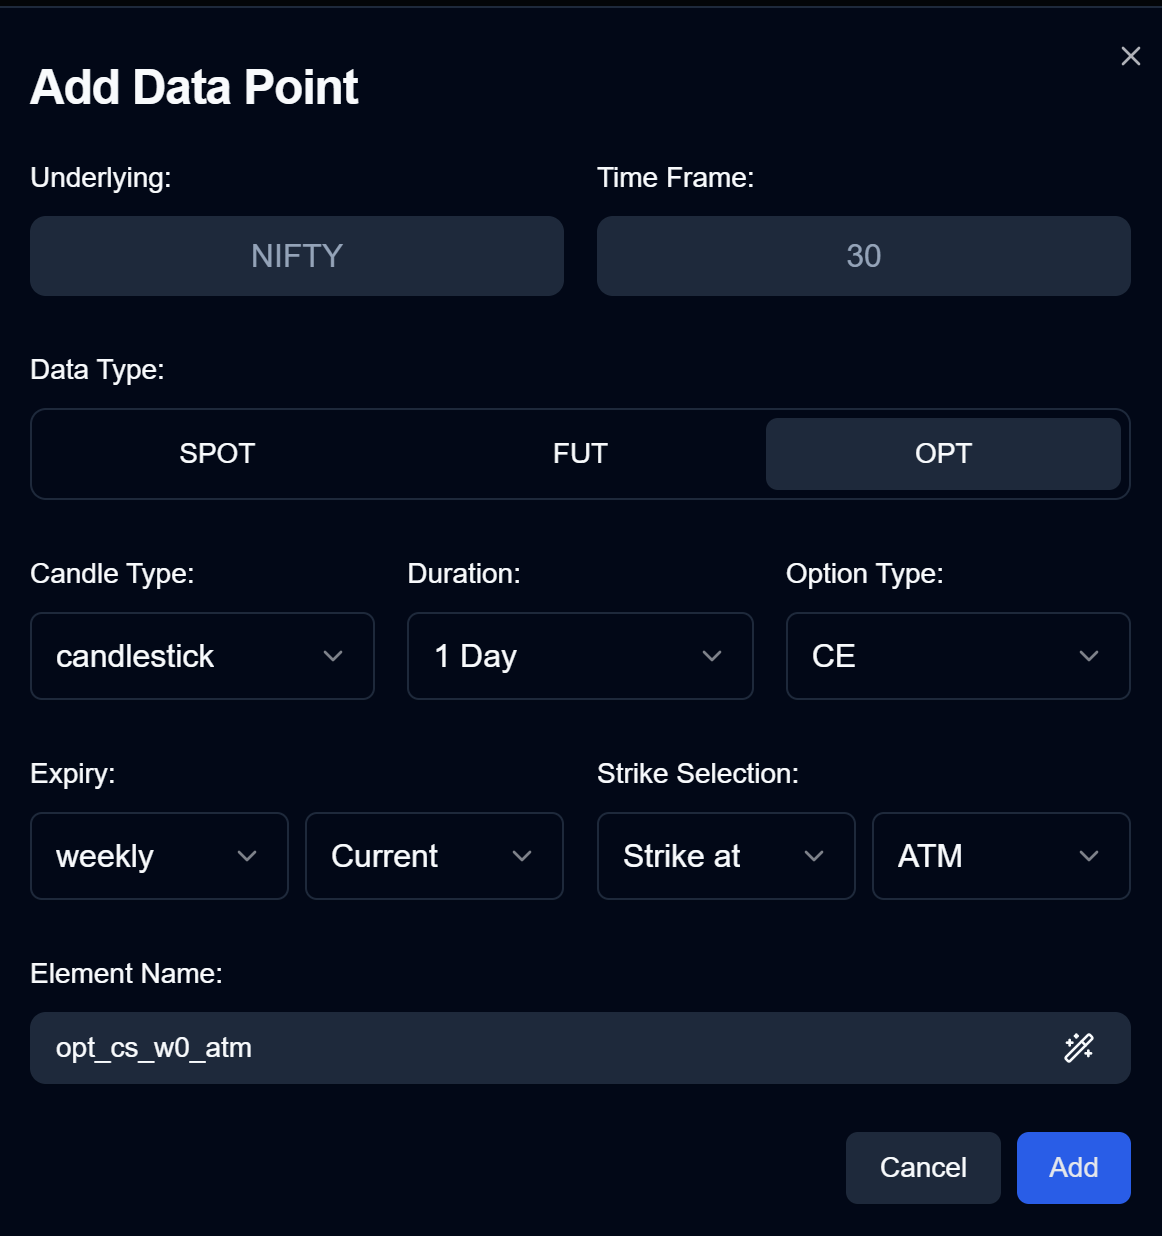
- Represents prices of Options Contracts for the selected symbol.
- Allows the following configurations:
- Option Type: Call (CE) or Put (PE)
- Expiry Type: Weekly or Monthly
- Expiry Number: Current, Next, or Next+1
- Strike Selection:
- Based on moneyness (ATM, ITM, OTM)
- Supports selecting up to 10 strikes above or below ATM
Additional Configurations
1. Duration
This setting defines how much historical data is fetched from the database.
| Value | Description |
|---|---|
| 0 | Data from current market session only |
| 1 | Includes previous day’s market data as well |
- Impacts indicator accuracy:
More historical data = Better calculations - But also increases latency due to larger data fetch
Example (1-Minute Timeframe):
- Market hours: 9:15 AM to 3:30 PM = 375 candles/day
- In a 15-Minute timeframe:
- 375 / 15 = 25 candles per day
- If
duration = 0: Only today’s 25 candles are available - If
duration = 1: Includes yesterday’s candles too for smoother indicator values
2. Candle Type
Determines how candle data is displayed:
Standard Candlestick
- Traditional OHLC (Open, High, Low, Close) values for each candle
Heiken Ashi
- Uses modified OHLC values to smooth out price trends
- Especially useful for identifying clear trend direction
3. Expiry Selection (For Futures & Options Only)
- Expiry Type: Select between Weekly or Monthly contracts
- Expiry Number:
Current: Nearest expiryNext: One expiry aheadNext+1: Two expiries ahead
Strike Selection (For Options Only)
Enables selection of strike prices based on different logic:
- Choose ATM (At-the-money), ITM (In-the-money), or OTM (Out-of-the-money) strikes
- Supports up to 10 strikes away from the underlying price
You can also select strikes:
- Based on premium value
- Using Expiry (Weekly/Monthly)
- With rounding rules
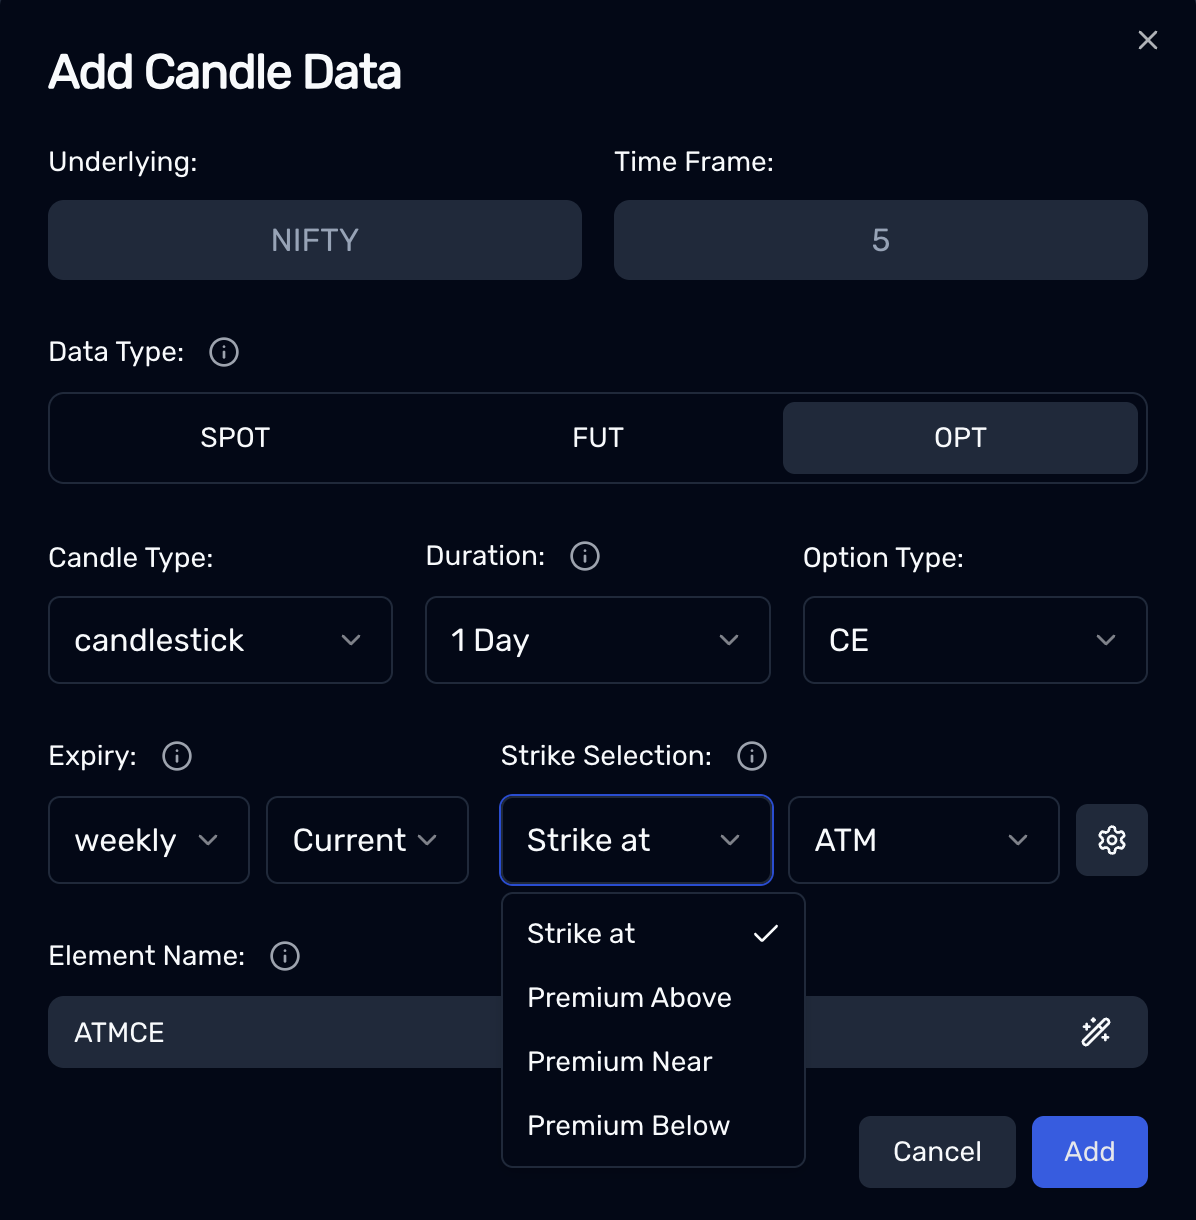
Strike Selection Based on Premium Type
After choosing the Option symbol, users can further define how the strike is selected in relation to the premium value:
1. Premium Above
- Picks strike prices above the current premium
- Ideal for strategies expecting upward movement or targeting higher strikes

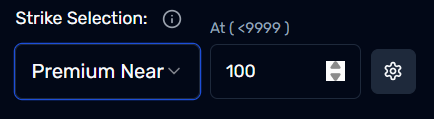
2. Premium Near
- Picks strike prices close to the current premium
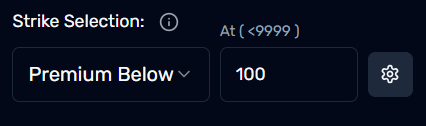
3. Premium Below
- Picks strike prices below the current premium
- Helps when targeting lower strike prices or reversal setups
Strike Settings
Users can enhance strike selection using additional tools:
Timestamp-Based Strike Selection
- Allows setting strike values based on specific timestamps
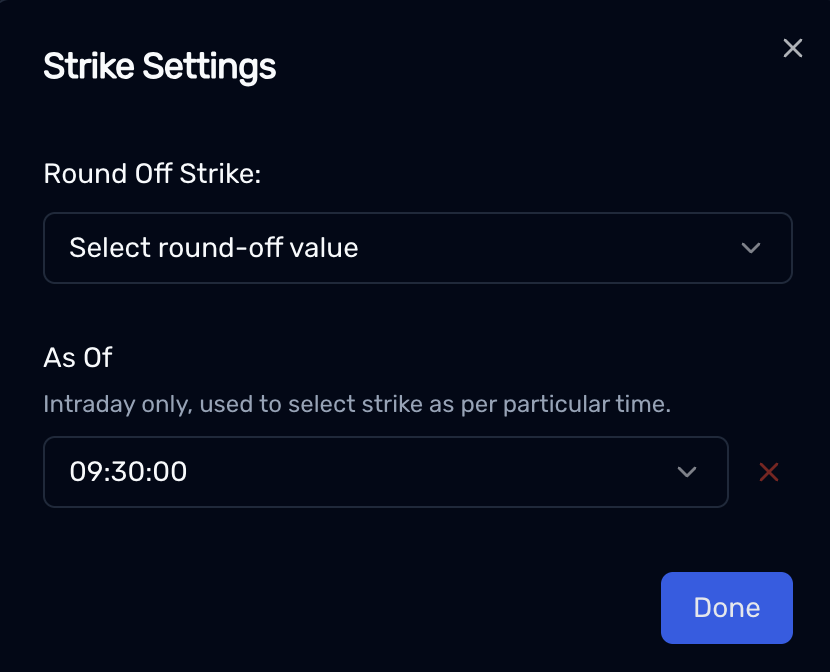
Round Strike Options
- Enables rounding strike prices to the nearest level:
- Nearest 100
- Nearest 200
- Nearest 500
- Nearest 1000
This provides better control in index and derivative strategies where strike prices are available at regular intervals.
Selecting higher duration values provides better indicator calculations, but also increases data-fetching latency.
Choose duration wisely depending on your strategy's indicator requirements.