Bollinger Bands (BB)
What are Bollinger Bands?
Bollinger Bands (BB) are a technical analysis tool that consists of a moving average and two standard deviation bands (upper and lower) plotted above and below it. This helps identify volatility and potential overbought or oversold conditions in the market.
How to Add Bollinger Bands?
- Click on the "+" button in the Indicators section.
- Select Bollinger Bands (BB).
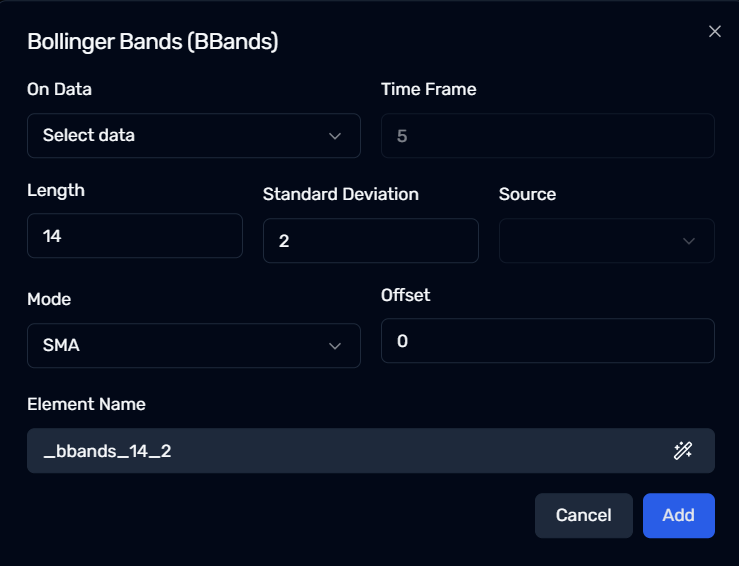
- Choose the data point to apply BB on.
- Configure the Length, Source, Time Frame, Standard Deviation, and Offset.
- Click "Add" to save the indicator.
Configurable Parameters in Bollinger Bands
1. On Data (Source Selection)
- Bollinger Bands require at least one column of data to operate.
- For multi-column Candle Data (OHLC), users must specify the Source (e.g., Close, Open).
- If no source is specified, Close Price is used by default.
2. Time Frame
- Defines the timeframe of the data used for Bollinger Bands calculation.
- Example: If set to 15, the bands will be calculated on 15-minute candle data.
3. Length
- Number of periods used to calculate the Moving Average and Standard Deviation.
- Example: A 20-length BB uses the last 20 data points.
4. Standard Deviation (SD)
- Controls the width of the upper and lower bands around the moving average.
- A common value is 2, which means the bands are placed 2 standard deviations above and below the moving average.
5. Offset
- Moves the entire Bollinger Bands indicator forward or backward in time.
- Positive offset = forward shift
Negative offset = backward shift
Applying BB on Other Indicators
Bollinger Bands can be used not just on price data, but also on other indicators.
If you're using a Volume or RSI indicator,
you can apply Bollinger Bands to measure volatility in those indicators.
Element Name
Each Bollinger Bands indicator is assigned a unique Element Name.
You can rename this to make strategies easier to manage.
When using multiple BBs in a strategy, give each a distinct Element Name.
Use Cases for Bollinger Bands
- Volatility Analysis
→ Use band width to identify high or low volatility periods. - Reversion to Mean Strategies
→ Price touching or crossing outside bands might signal mean reversion opportunities. - Breakout Detection
→ Sudden band expansion with price breakout may indicate new trends forming.
Always double-check the source column when applying BB to multi-column data.
Next Steps
✅ Add Bollinger Bands to your strategy
✅ Apply BB to Candle Data or other Indicators
✅ Use BB signals in Conditions & Actions