High-Low Average (HL2)
What is High-Low Average (HL2)?
High-Low Average (HL2) is a simple price indicator that calculates the average of the high and low prices of a candle. It provides a measure of the central price tendency based on the trading range of each period.
The formula for HL2 is:
HL2 = (High + Low) / 2
Key Points:
- Represents the midpoint of a candle's trading range
- Often used as an alternative price reference to closing price
- Provides a balanced view of price action by considering both extremes
- Can be used as input for other technical indicators
How to Add a High-Low Average (HL2) Indicator?
- Go to Indicators → "+" button
- Select High-Low Average (HL2)
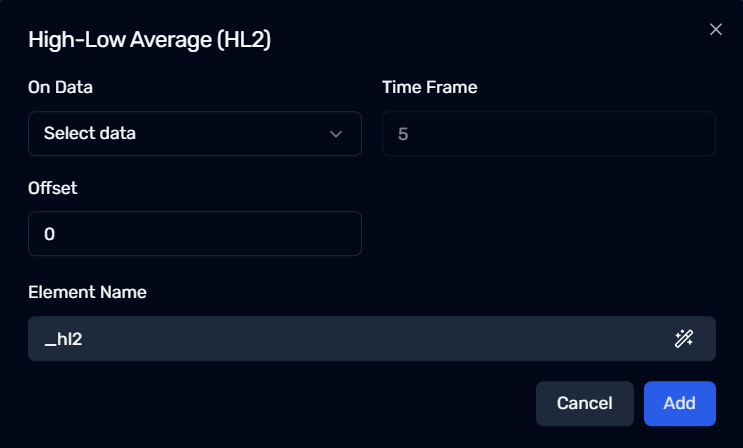
- Configure your settings as shown in the interface
- Click "Add" to add the indicator to your strategy
Configurable Parameters in HL2
1. On Data
- Select which price data you want to apply the HL2 calculation to
- Typically uses candlestick data
2. Time Frame
- Defines the candle interval (5 = 5-minute candles as shown in the image)
3. Offset
- Shifts the indicator forward or backward (0 in the image) in time
- Positive values move the indicator to the right, negative to the left
Element Name
- The default label is
_hl2as shown in the image - You can rename this indicator for clarity in your strategy code
Use Cases for High-Low Average (HL2)
-
Alternative Price Reference
→ Use as an input to other indicators instead of close price
→ May provide smoother results in volatile markets -
Support and Resistance Identification
→ HL2 can help identify potential support and resistance levels -
Trend Direction
→ Compare current HL2 with previous values to determine trend direction -
Custom Indicator Input
→ Basis for custom indicators that need a balanced price representation -
Moving Average Calculations
→ Use as input for moving averages to create a midpoint-based MA
Next Steps
✅ Compare trading results using HL2 versus close price as inputs
✅ Experiment with HL2 as source data for momentum indicators
✅ Consider combining with Typical Price (HLC3) or OHLC4 for comparison
✅ Test HL2 as an entry/exit price reference in strategies