Moving Average Convergence Divergence (MACD)
What is MACD?
MACD is a trend-following momentum indicator that shows the relationship between two moving averages of a security's price. It's calculated by subtracting the longer-term moving average from the shorter-term moving average.
The MACD indicator consists of three components:
- MACD Line - The difference between fast and slow EMAs
- Signal Line - An EMA of the MACD Line
- Histogram - The difference between MACD Line and Signal Line
Key Points:
- Helps identify trend direction, momentum, and potential reversal points
- Works best in trending markets
- Combines multiple moving averages into one indicator
How to Add a MACD Indicator?
- Go to Indicators → "+" button
- Select Moving Average Convergence Divergence (MACD)
- Configure your settings as shown in the interface
- Click "Add" to add the indicator to your strategy
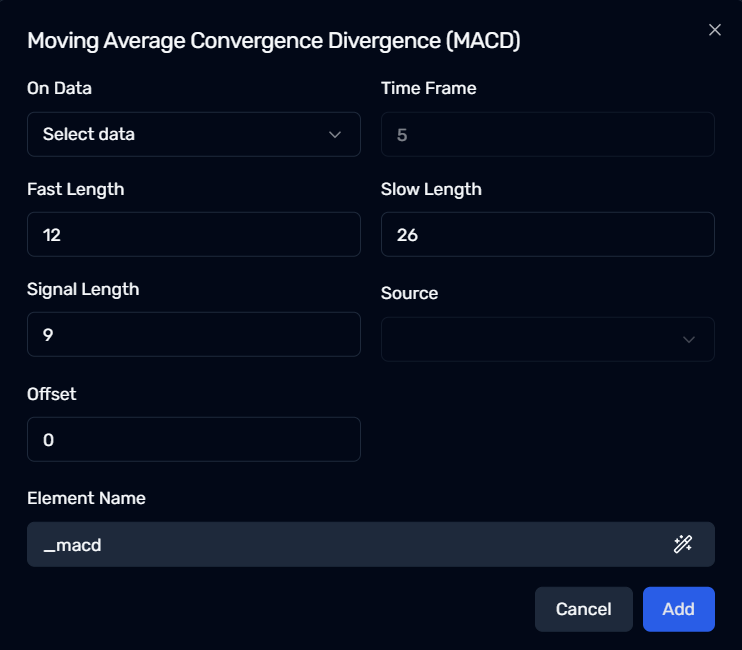
Configurable Parameters in MACD
1. On Data
- Select which price data you want to apply the MACD to
2. Time Frame
- Defines the candle interval (5 = 5-minute candles as shown in the image)
3. Fast Length
- The period of the faster/shorter EMA (12 in the image)
- Responds more quickly to recent price changes
4. Slow Length
- The period of the slower/longer EMA (26 in the image)
- Creates a more smoothed line less sensitive to recent changes
5. Signal Length
- The number of periods (9 in the image) used to calculate the signal line
- Acts as a trigger for buy/sell decisions
6. Source
- The price data used in calculations (typically close price)
7. Offset
- Shifts the indicator forward or backward (0 in the image) in time
Element Name
- The default label is
_macdas shown in the image - You can rename this indicator for clarity, especially if using multiple MACD indicators
Use Cases for MACD
-
Signal Line Crossovers
→ When MACD line crosses above signal line (potential buy signal)
→ When MACD line crosses below signal line (potential sell signal) -
Zero Line Crossovers
→ When MACD crosses above zero (bullish momentum)
→ When MACD crosses below zero (bearish momentum) -
Divergence Detection
→ When price makes new highs/lows but MACD doesn't confirm -
Histogram Analysis
→ Increasing histogram values indicate strengthening momentum
→ Decreasing histogram values indicate weakening momentum
Next Steps
✅ Experiment with different Fast & Slow Lengths to match your trading timeframe
✅ Combine MACD signals with other indicators for confirmation
✅ Look for divergences between price action and MACD lines
✅ Test using MACD histogram for early momentum shift signals