High–Low–Close Average (HLC3)
What is HLC3?
The High–Low–Close Average (HLC3) is a commonly used price average in technical analysis.
It calculates the average of the High, Low, and Close prices of each candle using the formula:
HLC3 = (High + Low + Close) / 3
This indicator helps smooth out volatility and is often used as a base for other indicators or signals.
How to Add an HLC3 Indicator?
- Click on the "+" button in the Indicators section.
- Select High–Low–Close Average (HLC3).
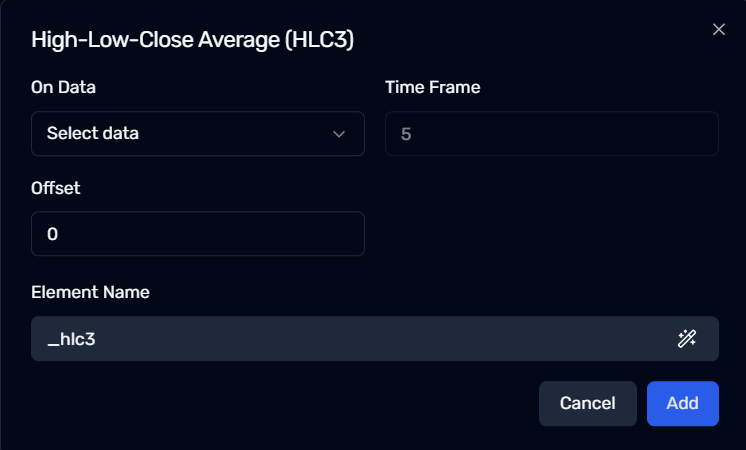
- Choose the data point to apply HLC3 on.
- Configure the Time Frame and Offset.
- Click "Add" to save the indicator.
Configurable Parameters in HLC3
1. On Data (Source Selection)
- HLC3 requires Candle Data that contains High, Low, and Close prices.
- Users must select the appropriate candle data from the dropdown.
- The formula will automatically apply to the High, Low, and Close columns of the selected data.
2. Time Frame
- Defines the interval for the data used in the HLC3 calculation.
- Example: If set to 5, the HLC3 will be calculated on 5-minute candle data.
3. Offset
- Moves the entire HLC3 indicator forward or backward in time.
- A positive offset shifts it forward; a negative offset shifts it backward.
Element Name
Each HLC3 indicator is assigned a default Element Name which can be renamed for clarity.
If you're using multiple HLC3 indicators in a strategy, it's a good idea to rename them to keep things organized.
Use Cases for HLC3
- Price Averaging
→ Offers a smoothed price average that balances volatility. - Input for Other Indicators
→ Can be used as a base for applying indicators like EMA or RSI. - Trend Confirmation
→ Helps identify central tendency of price movement over a period.
Ensure that the selected data has valid High, Low, and Close columns for accurate HLC3 calculation.
Next Steps
✅ Add HLC3 to your strategy
✅ Use HLC3 as a smoother price input
✅ Combine HLC3 with other indicators for enhanced signal generation