Pivot Points (PP)
What are Pivot Points?
Pivot Points (PP) are a popular technical analysis tool used to determine potential support and resistance levels in a trading session.
They are calculated based on the previous trading session’s High, Low, and Close (and sometimes extended with multiple levels like R1, R2, R3, S1, S2, S3).
Pivot Points can help traders:
- Quickly identify key price levels where market sentiment might change.
- Plan intraday trading strategies by focusing on breakouts or bounces near these levels.
How to Add Pivot Points?
- Go to Indicators and click the "+" button.
- Select Pivot Points (PP) from the list.
- Choose the data (such as candlestick data) you want to apply Pivot Points on.
- (Optional) Adjust additional parameters if available.
- Click "Add" to activate this indicator.
Configurable Parameters in Pivot Points
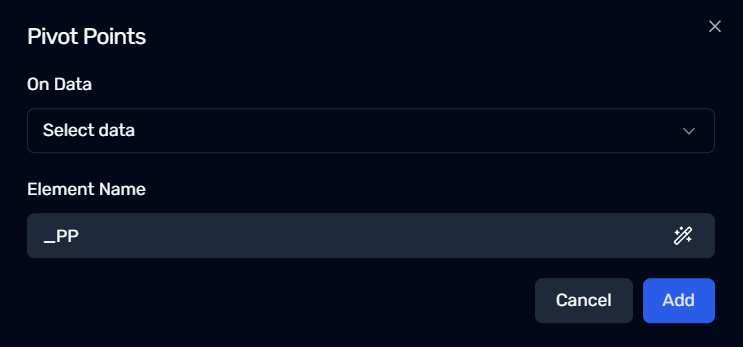
1. On Data
- Select Data: Choose the candle data (High, Low, Close) used to generate Pivot Points.
- Pivot points is calculated as per previous day's OHLC.
2. Element Name
- By default, Pivot Points are labeled
_PP. - You can rename it to differentiate multiple Pivot Point indicators if necessary.
How Pivot Points are Calculated (Basic Formula)
A classic (Floor) Pivot Point formula is:
Pivot Point = (Previous High + Previous Low + Previous Close) / 3
Resistance 1 (R1) = (2 * ((Previous High + Previous Low + Previous Close) / 3)) - Previous Low
Support 1 (S1) = (2 * ((Previous High + Previous Low + Previous Close) / 3)) - Previous High
Resistance (R2) = ((Previous High + Previous Low + Previous Close) / 3) + (Previous High - Previous Low)
Support (S2) = ((Previous High + Previous Low + Previous Close) / 3) - (Previous High - Previous Low),
Resistance 3 (R3) = Previous High + 2 * (((Previous High + Previous Low + Previous Close) / 3) - Previous Low),
Support 3 (S3) = Previous Low - 2 * (Previous High - ((Previous High + Previous Low + Previous Close) / 3))
Use Cases for Pivot Points
- Identifying Intraday Reversals
→ Price bouncing off S1 or R1 may indicate a short-term reversal. - Breakout Trading
→ A significant move above R1 (or below S1) can signal a continuation of momentum. - Target Setting
→ Pivot levels can serve as potential profit targets or stop-loss areas.
Next Steps
✅ Add Pivot Points to your strategy
✅ Watch for reactions around key pivot levels
✅ Combine PP with momentum indicators (e.g., RSI, MACD) for confirmation