Stochastic RSI (StochRSI)
What is Stochastic RSI?
Stochastic RSI (StochRSI) is an oscillator that applies the Stochastic formula to the Relative Strength Index (RSI) values instead of price data.
It ranges between 0 and 1 (or 0% to 100%) and helps traders identify overbought or oversold conditions more precisely than a standard RSI.
Key Points:
- Combines momentum (RSI) with stochastic measurements (K & D periods).
- Typically includes %K and %D lines to generate crossover signals.
How to Add a Stochastic RSI Indicator?
- Go to Indicators → "+" button.
- Select Stochastic RSI (StochRSI).
- Choose your data (candles or another data source).
- Set Time Frame, Length, RSI Length, K Period, D Period, Offset, Mode, and Source.
- Click "Add" to add the indicator to your strategy.
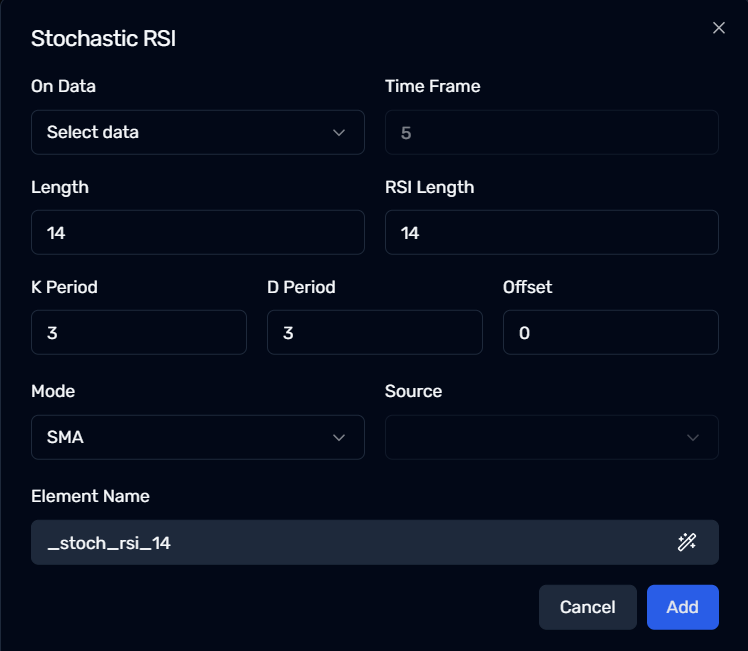
Configurable Parameters in StochRSI
1. On Data
- Select which price data or indicator values you want to measure with StochRSI.
2. Time Frame
- Defines the candle interval. For example, 5 = 5-minute candles.
3. Length
- The Stochastic oscillator length; determines how many periods are used to find the %K line.
4. RSI Length
- The number of periods for calculating RSI before applying the stochastic formula.
5. K Period
- Determines the smoothing for the stochastic %K line.
6. D Period
- Determines the smoothing for the stochastic %D line (a moving average of %K).
7. Offset
- Shifts the entire indicator forward (positive) or backward (negative) in time.
8. Mode
- Specifies which moving average type (e.g., SMA, EMA) to use when calculating the internal smoothing.
9. Source
- The data column used in RSI calculations:
- Close (default)
- Open
- High
- Low
- etc.
Element Name
- Default label is
_stoch_rsi_14(or similar based on your inputs). - You can rename this indicator for clarity, especially if using multiple StochRSIs.
Use Cases for StochRSI
- Overbought/Oversold Detection
→ Look for values above 0.8 or below 0.2. - Divergence Signals
→ Compare StochRSI direction with price action. - Trend Confirmation
→ Combine StochRSI crossovers with other trend indicators (e.g., Moving Average).
Next Steps
✅ Experiment with different K & D Periods
✅ Combine StochRSI signals with trend indicators (e.g., MACD, Bollinger Bands)
✅ Configure your Length and RSI Length to suit your trading style